
According to the United States Federal Reserve:
- The bottom 50% of Americans own 5.9% of America’s wealth
- The bottom 90% of Americans own 36.1% of America’s wealth
- The bottom 99% of Americans own 71.7% of America’s wealth
- The bottom 99.9% of Americans own 88.6% of America’s wealth
Equivalently:
- The top 50% of Americans own 94.1% of America’s wealth
- The top 10% of Americans own 63.9% of America’s wealth
- The top 1% of Americans own 28.3% of America’s wealth
- The top 0.1% of Americans own 11.4% of America’s wealth
The bottom 20% of Americans actually have negative wealth, as illustrated well in this excellent CBS segment: Americans know wealth inequality is a problem, but what does it look like? - CBS
According to The Federal Reserve Bank of St. Louis, “The top 10% of households by wealth had $6.8 million on average. As a group, they held 69% of total household wealth. The bottom 50% of households by wealth had $48,000 on average. As a group, they held only 2.4% of total household wealth.”
Americans generally embrace capitalism but have no idea how unequally the benefits are shared (or, rather, NOT shared) across our society.
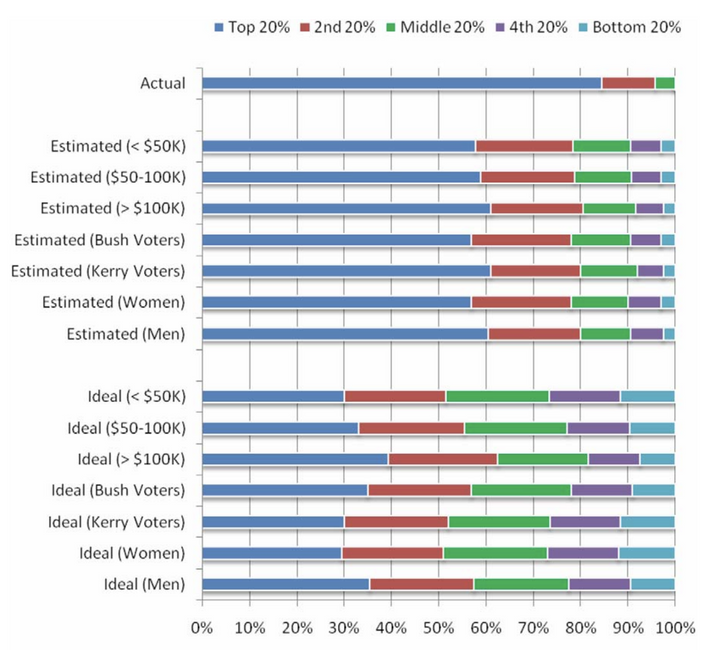
Their Figure 2 displays America’s actual income distribution, the income distribution Americans believe America has, and Americans’ optimal/ideal/desired income distribution:
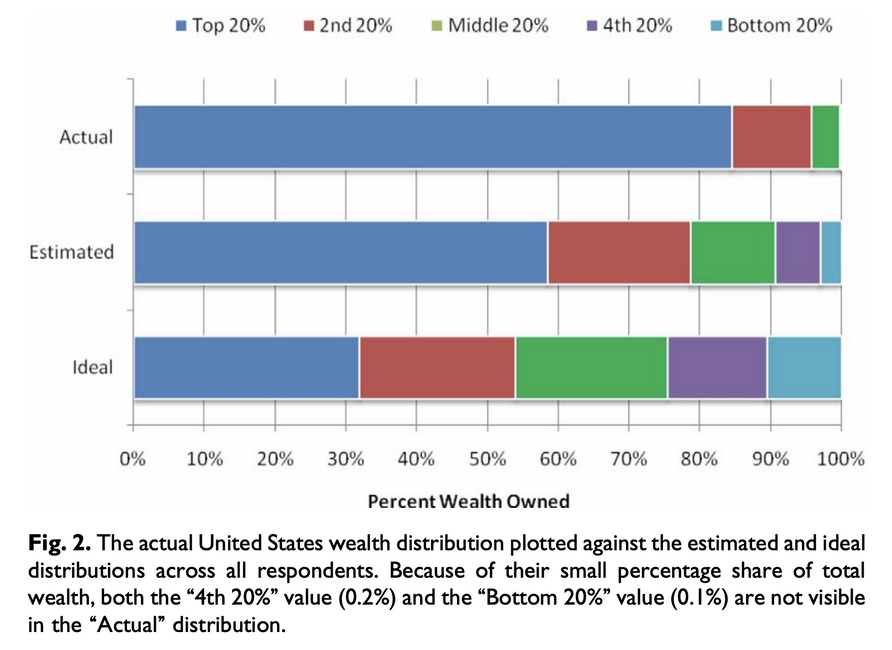
Americans want a far more even income distribution than they believe America has, but the income distribution Americans think they have is actually far more even than the income distribution we actually have. In the graph of actual income distribution, the bottom 40% isn’t even visible, and the next 40% of Americans have only a small sliver, since most of America’s wealth is owned by the top 20%!!!
Perhaps even more shockingly, the study found that all kinds of Americans – rich and poor, Democrats and Republicans, men and women – were roughly equally wrong about how unequal American income is and desire a roughly similar egalitarian income distribution. Most Americans actually agree that our country should have a much more equal income distribution, and most Americans wrongly believe our income distribution is much more equal than it actually is.
This decade-old video presented nicely the facts from this study: Wealth Inequality in America
This simple website visualization will give you a gut sense of how insanely wealthy Jeff Bezos is relative to an ordinary American, a millionaire, and even a plain old billionaire.
The numbers above relate to wealth, but the same general pattern also holds for income, but not as severely as for wealth.
In the 12 years since the Harvard/Duke study was published, inequality has gotten worse, but people have become somewhat more aware of how unequal societal wealth has become, as the Pew Research Center explains: How do Americans view economic inequality?
I knew about these facts and studies but was reminded of them today by this nice video by Humphrey Yang, which you might also enjoy:
Wealth Inequality in America: Visualized for 2023
With appreciation to Clay LeConey for sharing his photo on Unsplach.com